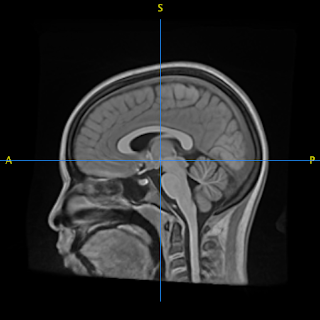
There are several ways you can go about producing an atlas of a brain but the most common method uses brain registration techniques (like demonstrated here). Currently the most effective method of doing so is using the advanced normalization tools (ANTs) function for joint label fusion (it’s beyond the scope of this post to demonstrate this but there’s plenty research available; Multi-Atlas Segmentation with Joint Label Fusion. DOI: 10.1109/TPAMI.2012.143).
My last post was on how to obtain a representative sample to create a brain template. This post shows how to create the actual template. This step is fairly straightforward because most of the heavy lifting is already performed by antsMultivariateTemplateContstruction.sh . Here’s the entirety of the script so that you have an idea of how it all looks together. #!/bin/bash #SBATCH --time=75:00:00 #SBATCH --ntasks=1 #SBATCH --nodes=1 #SBATCH --mem-per-cpu=32768M #SBATCH -o /fslhome/username/logfiles/dataset/output_temp.txt #SBATCH -e /fslhome/username/logfiles/dataset/error_temp.txt #SBATCH -J "ucsdtemp" #SBATCH --mail-user=LongbranchPennywhistle@gmail.com #SBATCH --mail-type=BEGIN #SBATCH --mail-type=END #SBATCH --mail-type=FAIL export PBS_NODEFILE=`/fslapps/fslutils/generate_pbs_nodefile` export PBS_JOBID=$SLURM_JOB_ID export PBS_O_WORKDIR="$SLURM_SUBMIT_DIR" export PBS_QUEUE=batch export OMP_NUM_THREADS...
The following represents the current extent to which the iClass package I’ve been developing has been tested. The goal is to impliment it in ANTsR eventually when I’m not in the midst of medical school classes. For now this can be used if ANTsR is already installed and the following code is run to download the package from github. ## install.packages("devtools") devtools::install_github("Tokazama/iClass") library(ANTsR) library(h5) home <- '/Volumes/SANDISK/datasets/ucsd/' ucsd <- read.csv(paste(home, 'spreadsheets/ucsdWOna.csv', sep = ""))[, -1] iGroup The first thing I want to do is create an object that represents my image information in a convenient way. I can do this using the iGroup class. The following demonstrates how I do so with whole brain morphometry images. wblist <- c() boolwb <- rep(FALSE, nrow(ucsd)) for (i in 1:nrow(ucsd)) { tmppath <- pas...
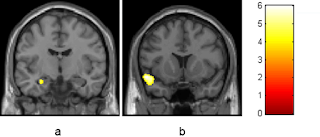
Today my goal is to develop some methods for comparing an individual's neuroanatomy to a population's and make some graphs that help convey my findings. To demonstrate this I will be using the Pediatric Template of Brain Perfusion (PTBP), which has already been processed and can be found here . I'll start off by loading some libraries I'll need and the CSV file. The CSV file contain demographics data and anatomically specific information about the cortical thickness, fractional anistrophy, cerebral blood flow, and blood oxygenation level. For now I'm just going to focus on cortical thickness (found by the prefix “Thick*”). Picture of amygdala from recent paper on the effects of cannabis suppressPackageStartupMessages(library(dplyr)) suppressPackageStartupMessages(library(ggplot2)) home <- '/Users/zach8769/' ptbp <- read.csv(paste(home, 'Desktop/ptbp/data/ptbp_summary_demographics.csv', sep = ""), header = TRUE) thick_pt...

Comments
Post a Comment