Visualizing Cortical Thickness In a Population

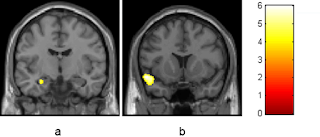
Today my goal is to develop some methods for comparing an individual's neuroanatomy to a population's and make some graphs that help convey my findings. To demonstrate this I will be using the Pediatric Template of Brain Perfusion (PTBP), which has already been processed and can be found here . I'll start off by loading some libraries I'll need and the CSV file. The CSV file contain demographics data and anatomically specific information about the cortical thickness, fractional anistrophy, cerebral blood flow, and blood oxygenation level. For now I'm just going to focus on cortical thickness (found by the prefix “Thick*”). Picture of amygdala from recent paper on the effects of cannabis suppressPackageStartupMessages(library(dplyr)) suppressPackageStartupMessages(library(ggplot2)) home <- '/Users/zach8769/' ptbp <- read.csv(paste(home, 'Desktop/ptbp/data/ptbp_summary_demographics.csv', sep = ""), header = TRUE) thick_pt...